On April 8, Ripple (XRP/USD) witnessed a notable ascent, climbing 5.03% to $0.62334. Ripple CEO Brad Garlinghouse projects the cryptocurrency market cap to tanger to $5 trillion in 2023, propelled by significant developments like the U.S. launch of spot bitcoin ETFs on January 10.
Bitcoin Halving and Market Supply Dynamics
The anticipated bitcoin halving event, expected later this month, is set to halve the reward for bitcoin mining. This event, occurring every four years, last happened in 2020 and is a critical factor in reducing bitcoin supply, potentially boosting its price and influencing the broader crypto market, including XRP/USD.
Regulatory Environment and Crypto Growth
Positive regulatory developments in the U.S. are also expected to fuel market growth. With the SEC’s increasing scrutiny under Gary Gensler, the industry anticipates clearer regulations, which could lead to a more favourable environment for cryptocurrencies like XRP.
This optimism is mirrored by predictions from industry leaders, like Gemini’s COO Marshall Beard, who forecasts bitcoin reaching $150,000 in 2023, hinting at a robust period for the crypto market that could significantly impact the XRP/USD price.
The current market cap of $2.6 trillion as of early April, with bitcoin constituting about 49% of this value, underscores the potential for substantial market movements. With bitcoin’s record high of over $73,000 in March and its subsequent fluctuations, the crypto market is poised for volatile yet upward trajectories.
Garlinghouse’s optimistic view, coupled with pending regulatory clarity and significant crypto events like the halving, paints a bullish picture for XRP/USD in the evolving landscape of cryptocurrency investments.
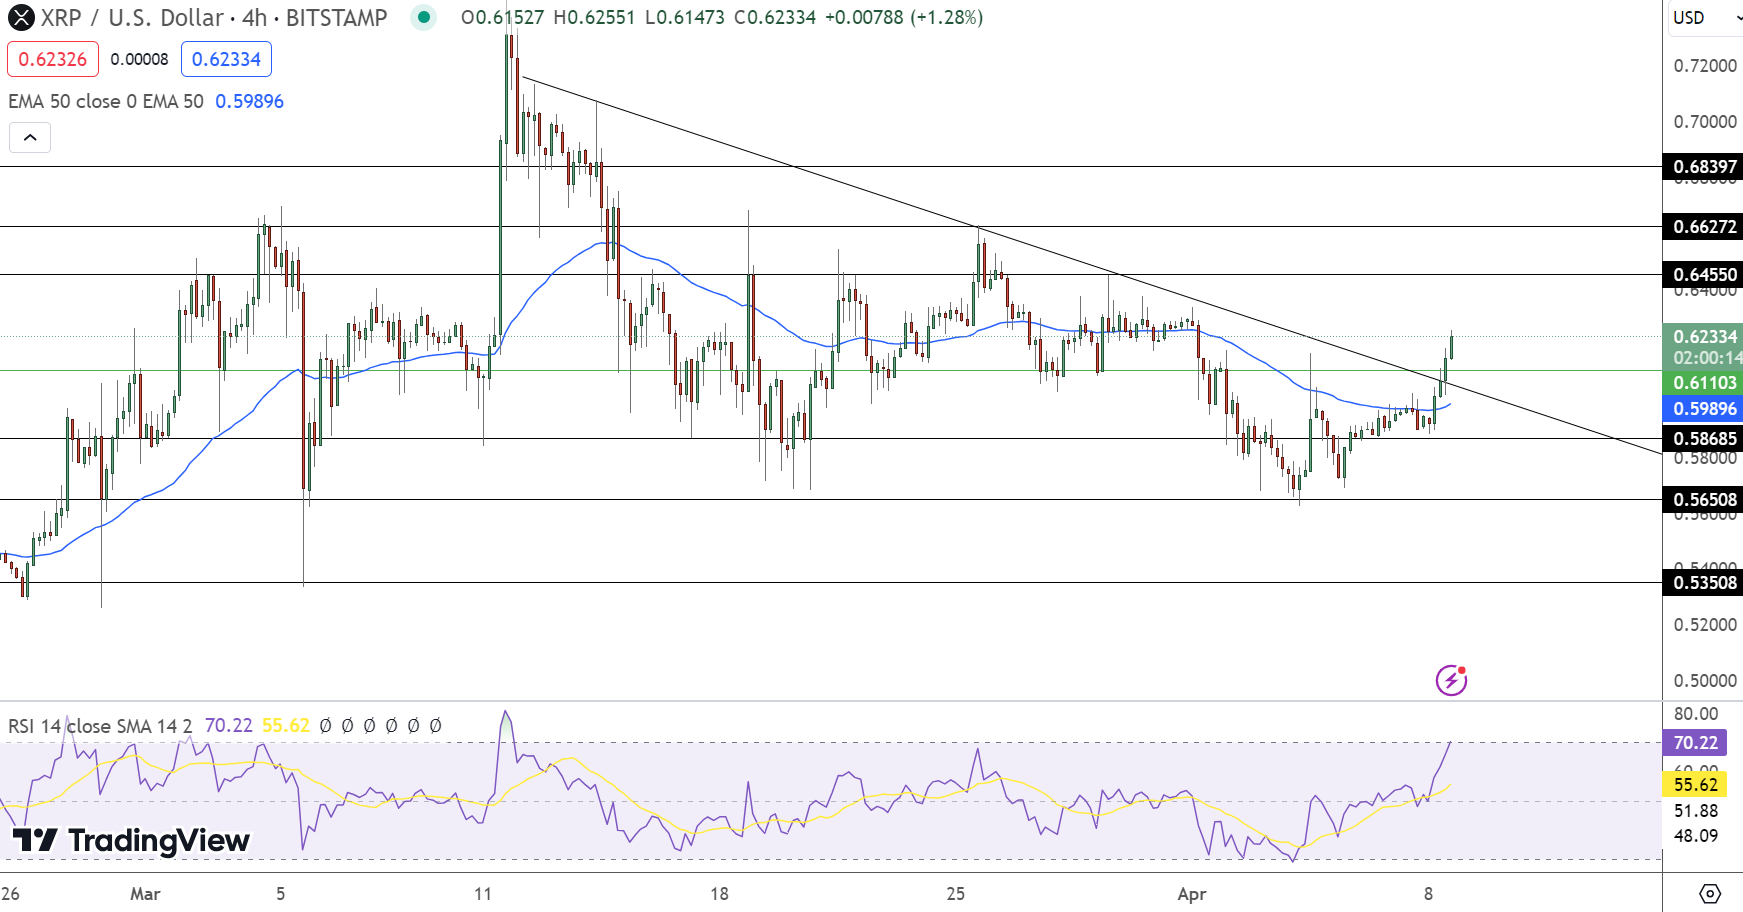
XRP/USD Price Forecast; Daily Outlook
On April 8, Ripple (XRP/USD) witnessed a notable ascent, climbing 5.03% to $0.62334. The asset breached the pivotal $0.6110 level, indicating strong bullish momentum. Resistance points are identified at $0.6455, $0.6627, and $0.6840, with support levels at $0.5869, $0.5651, and $0.5351.
The Relative Strength Index (RSI) at 70 signals potential overbought conditions, yet the upward momentum persists. The 50-day Exponential Moving Average (EMA) at $0.5990 further underlines the bullish trend.
The formation of three white soldiers’ candlestick pattern post-breakout suggests a continuation of the upward trajectory for XRP/USD. Consequently, the outlook for Ripple remains bullish above $0.6110, though a dip below this threshold could trigger a significant sell-off, emphasizing the critical nature of this support level.